One data model
Every panel, camera, rack, sensor and server is normalised into the same site, hall, row, rack and device hierarchy. An event therefore carries its exact location and what sits next to it.
 TakhitechSOFTWARE
Sightline PLATFORM
TakhitechSOFTWARE
Sightline PLATFORM
One console for your alarm panels, cameras, UPS, generators, cooling, power and compute. A guided workflow walks the operator step by step through how to handle what it finds.
A hall generates millions of signals a day across a dozen systems that do not talk to each other. Operators end up moving between a DVR, a BMS, a DCIM dashboard and a paper runbook. Sightline puts the events that need a person into one queue and handles them one at a time.
Every panel, camera, rack, sensor and server is normalised into the same site, hall, row, rack and device hierarchy. An event therefore carries its exact location and what sits next to it.
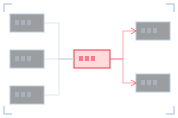
Correlation, deduplication and suppression run before anything reaches a human. Related signals collapse into a single incident, ranked by severity, SLA clock and business impact.
Each event type carries its own response plan. The operator answers one question at a time. Each answer branches the workflow and is written to the record.
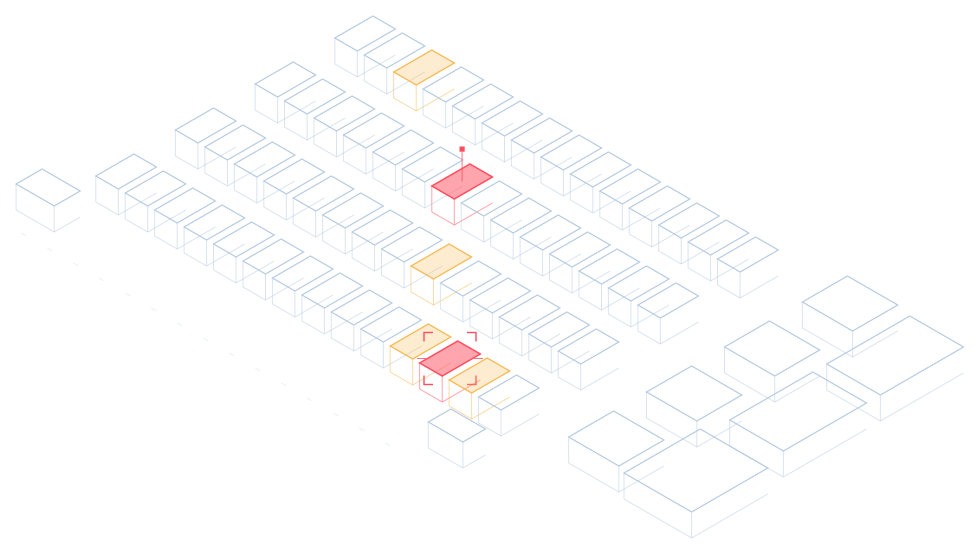
The site model is generated from the same hierarchy that drives your alarms, so there is no separate drawing to maintain. Rows, racks, CRAC units, UPS and the generator yard are laid out live and colour-coded by state. Click anything to open it.
Layout is derived from the site hierarchy, with optional floor-plan image overlay and geofence data. A new row appears in the view once it exists in the system.
Switch the floor between alarm status, thermal gradient, power draw per rack and security state.
Every rack, door and aisle is linked to the cameras covering it. Clicking a location in alarm opens the live feed and the clip from the moment it tripped.
Easy for operators. A simple workflow guides the operator through a step by step list of actions. Each step shows the instruction, the evidence and the contact list together. The operator picks an option and the workflow moves to the next step, escalating, dispatching or closing the event as it goes. Nobody has to remember the procedure.
Anything with an API, an SNMP agent, a Modbus register or a dry contact can be brought in and normalised into the same event model. A failing fan tray and a forced door are then handled the same way by the same operator.
Zones, areas and modules mapped to physical racks and rooms, with arm/disarm state and test mode.
Live streams, pre/post-event clips auto-attached to the incident, analytics and tamper detection.
Door forced and held-open events, badge history, escort and visitor tracking per cage and aisle.
Load, runtime remaining, battery health and string temperature, self-test results and bypass state.
Fuel level, run hours, coolant, start failures, transfer events and weekly exercise verification.
Per-outlet draw, phase balance, breaker headroom and redundancy loss when an A or B feed drops.
Supply/return temps, compressor and fan status, chilled water flow, humidifier and filter alarms.
Rack-level temperature and humidity, differential pressure, airflow and thermal drift over time.
CPU, RAM, disk, fans, PSU redundancy, IPMI/Redfish health, SMART warnings and OS agents.
Switch and router reachability, port errors, uplink saturation, optic light levels and BGP session state.
Rope and spot sensors under floor and around CRAC units, pinned to their exact position on the plan.
VESDA aspiration levels, detector state, suppression release and abort, and interlock status.
Detection is the straightforward part. These are the capabilities that determine how long an event takes to close.
When a CRAC unit fails, twenty racks go hot, forty servers throttle and the panel reports a high-temp zone. That is one incident rather than sixty-one. Sightline groups signals by space, power chain, cooling chain and time window, promotes the probable root cause to the top, and files the rest as supporting evidence. A storm threshold holds low-value chatter during a major event.
Security events arrive with the clip already cut and attached, 10 seconds before to 20 after. The operator verifies it before anyone is dispatched.
Ordered contact lists per area with role, hours, instructions and duress codes. Failed contacts auto-advance; every attempt is timestamped.
Per-severity acknowledge and resolve timers run visibly on the card, escalate on breach, and roll into client-facing SLA reporting.
Raise a job from the event with the asset, location and evidence pre-filled, dispatch a technician, and track it back to close on the same record.
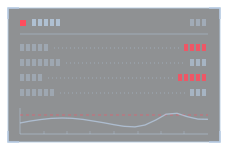
Baselines per rack and per circuit catch slow problems before they trip a threshold: thermal creep, battery capacity fade, fan degradation and gradual power drift.
An auto-composed handover brief: open incidents, suppressed items and their expiry, jobs in flight, and anything the next shift must watch.
Every view, decision, note and command is recorded against the event and the operator. Exportable for ISO 27001, SOC 2, uptime and insurance evidence.
Planned work suppresses the right zones for the right window, with automatic expiry and a visible reminder so nothing stays muted by accident.
Group halls, buildings and regions. Operators see only their scope; customers can be given a read-only view of just their cages.
The same queue and workflow on a phone for the walking tech, with QR scan on a rack to jump straight to its record.
Automate event handling with automation tools, including DAIOS, our automatic engagement AI solution. Events that do not need a person are handled without one, and the ones that do reach an operator with the work already done.
When an event fires, DAIOS engages the right contacts by voice, SMS, chatbot or email, captures their response, and posts the outcome back to the platform. No operator is involved unless one is needed.
Rules decide which events are handled automatically and which go to the queue, by event type, site, area and time of day. Low value signals are absorbed before anyone sees them.
Events that restore within a set window, or that are answered and resolved by a contact, close themselves with the reason and the full exchange written to the record.
Test modes, maintenance windows and planned suppressions run to a schedule and expire on their own, so nothing stays muted after the work is finished.
Automated engagement follows the same ordered contact list an operator would use, advancing when a contact does not answer and recording every attempt.
Anything automation cannot resolve arrives in the operator queue with the engagement history attached, so the operator starts from what has already been tried.